
Blue Chip Portfolio USD
October 2026
Overview
The Vanilla Funds Blue Chip Portolio looks to invest in US listed stocks and is actively managed, selecting from sectors that offer the most promising long-term performance.
The weightings and selections of the stocks will be determined on an ongoing basis, using a range of technical and fundamental metrics.
Investment Philosophy
The general approach to investing is based on the idea of offering portfolios built using large cap investments, with companies that have an excellent reputation, above average growth and lower risk financials. The aim is to achieve diversification by selecting stocks from at least 4 GICS (Global Industry Classification Standard sectors. The weights of the stocks in the portfolio are optimized using macro- economic forecasting models and market indicators.
Our asset allocation adapts to changes in the markets aiming to protect capital in a falling market while looking to identify the best investment opportunities in a timely manner.
Investment Strategy
We use state of the art technology to screen the stocks. This enables us, along with human overlay, determine economic cycles and risk appetite in the markets and to capture the risk premia across the stocks. The stocks are selected by Algo-Chain’s AI & Machine Learning assisted platform. This systematic framework carefully analyses the target universe of stocks and identifies the best investment opportunities based on market conditions.


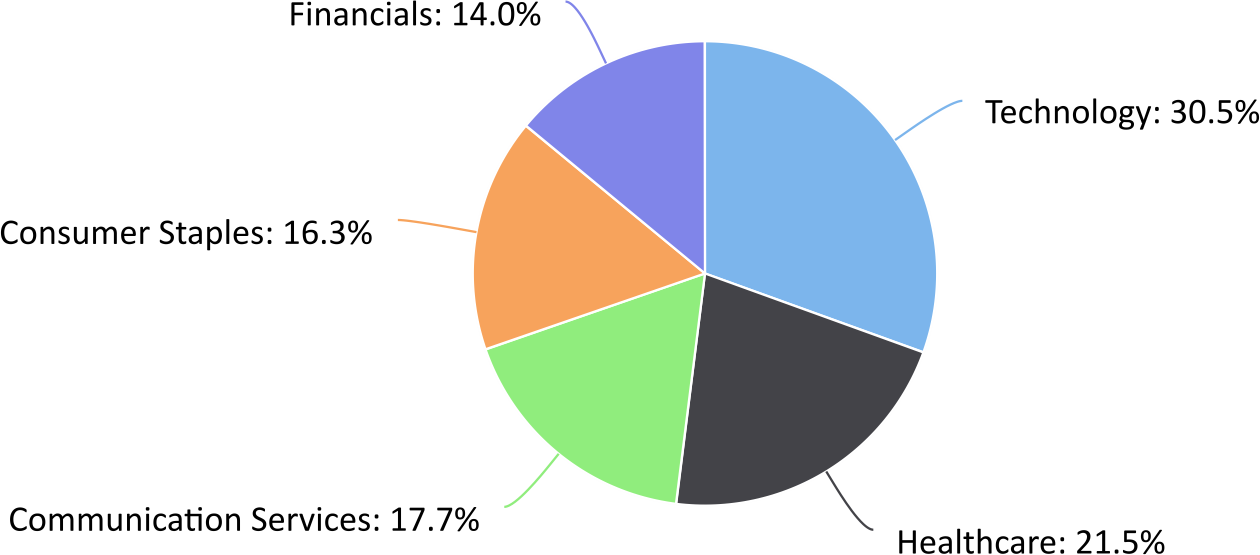
Equity Sector Allocations
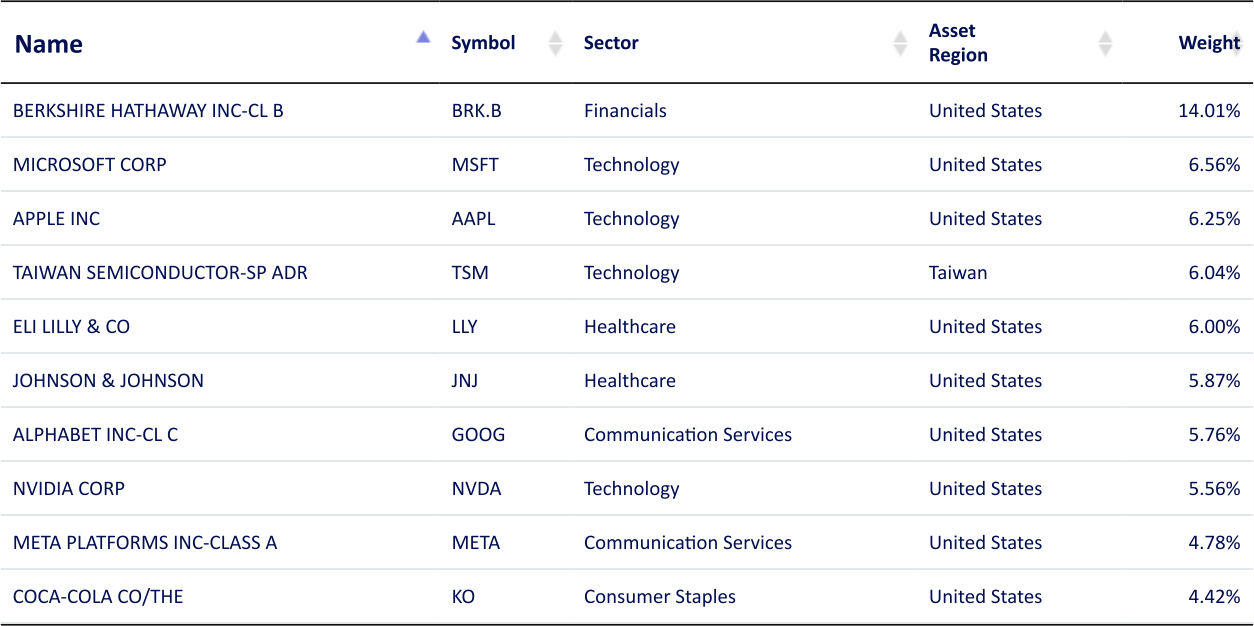
Portfolio Top 10 Holdings
Portfolio Performance vs. Benchmark Statistics
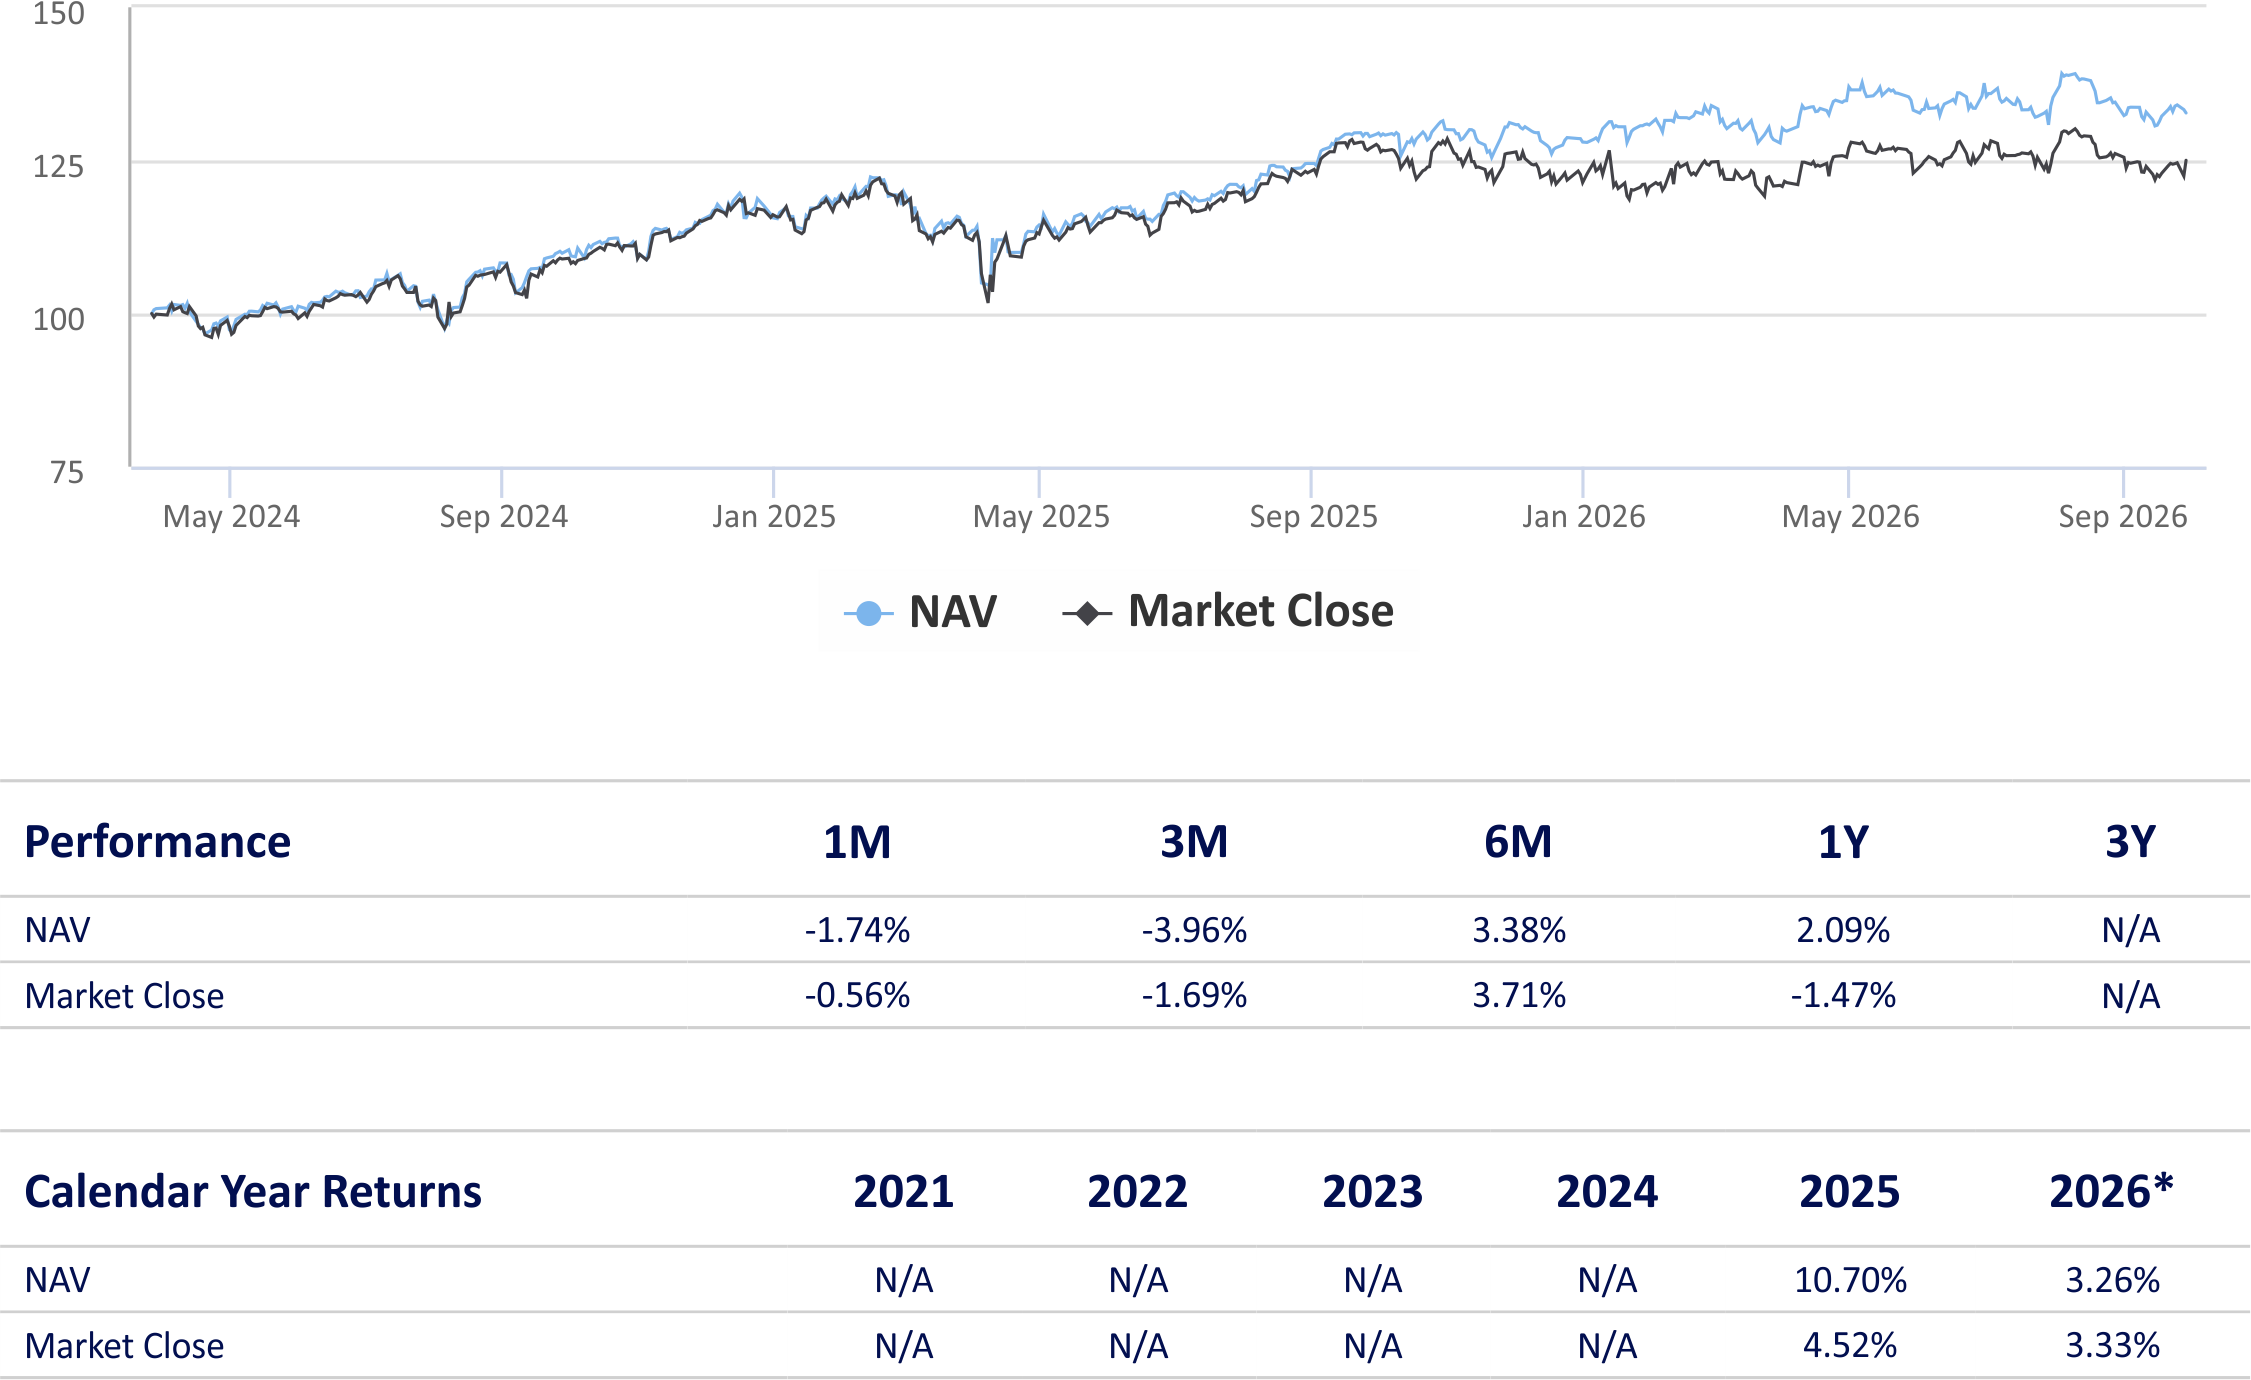
The chart shows two key measures of the fund’s value over tme: the market closing price of the ETP on the
London Stock Exchange and the fund’s official Net Asset Value (NAV). The NAV reflects the value of the
underlying portolio at the end of each day and represents the fund’s intrinsic value per share. The market
price, by contrast, is the level at which investors actually buy and sell the ETP on the exchange.
Because the ETP trades in the secondary market, its price is driven by supply and demand throughout the
trading day and may differ from the NAV. These differences, known as premiums or discounts, are normal for
exchange-traded products and are typically kept small by market makers. Together, the two lines help illustrate
both the underlying value of the fund and the real-world closing prices investors experience when trading it.
* Denotes YTD performance. The NAV data displayed in this document is provided by Leverage Shares and the
LSE Market Close Share Prices and benchmark data is provided by Algo-Chain.